
How to Make a Market Analysis for Your Business Plan
Your market analysis must prove four things to any reader who matters: the market is real, the customers are reachable, the opportunity is sized, and your positioning is defensible. Without those four proofs, the rest of your business plan floats on assumption.
Here are the five outputs you need to produce before writing a single paragraph of your plan:
- Industry snapshot with NAICS code: Identify your industry category and pull current size and growth data from a federal source.
- Defined primary customer segment: One specific group, described by demographics, geography, and buying behavior.
- TAM/SAM/SOM estimates: Three numbers, each with a documented source and calculation method.
- Top 3 competitor positions: Direct and indirect, mapped on at least one dimension (price, specialization, or convenience).
- Positioning statement: One sentence explaining why your target customer will choose you over every alternative.
Copy that list into a working document right now. Each item becomes a section heading in your market analysis. The rest of this guide shows you exactly how to fill each one.
Key Takeaways
A credible market analysis proves demand, sizes the opportunity with documented math, and connects directly to the financial projections in your plan.
| Point | Details |
|---|---|
| Start with your NAICS code | Use census.gov/naics to find your six-digit code before pulling any industry revenue or employment data. |
| Size the market in three layers | Calculate TAM, SAM, and SOM using both top-down and bottom-up methods; document every source and assumption. |
| Map competitors analytically | Limit your competitive analysis to five competitors and show your positioning on a two-axis matrix, not a name list. |
| Connect analysis to financials | Write one explicit sentence linking your SOM to the revenue figure in your financial projections. |
| Nomadexcel bootcamp sprint | Nomadexcel’s Online Entrepreneurship Bootcamp compresses the full market analysis process into structured daily sprints with mentor feedback. |
Table of Contents
- How to make a market analysis in your business plan
- What industry metrics should you measure, and where do you find them?
- How do you define and quantify your target market?
- How do you analyze your competition effectively?
- How do you estimate TAM, SAM, and SOM with real math?
- What are the best U.S. data sources for market research?
- How should you structure and present the market analysis section?
- A step-by-step checklist and template for your market analysis
- What mistakes do founders most often make in market analysis?
- The Nomadexcel perspective on teaching market analysis
- Nomadexcel’s bootcamp gives you a market analysis you can actually use
- Useful sources and recommended tools
- Sources
How to make a market analysis in your business plan
A market analysis is the section of a business plan that converts research into evidence. It answers the question every investor, lender, and co-founder asks before committing: “Does this market actually support the business you’re describing?” The section does not exist to show how much you know about your industry. It exists to make the financial projections that follow it credible.
Three reasons this section carries so much weight:
It underwrites your financials. Revenue forecasts are only as believable as the market data behind them. When your income statement projects $800,000 in year-two revenue, the market analysis is the document that shows where those customers come from and what they spend.
It reduces investor risk perception. The U.S. Small Business Administration recommends grounding your analysis in federal data sources, such as the U.S. Census Bureau and the Bureau of Economic Analysis, before validating with primary research. Citing those sources signals that your numbers are traceable, not invented.
It guides go-to-market decisions. Pricing, channel selection, and messaging all flow from what the market analysis reveals about customer behavior and competitive positioning. A well-built analysis does not sit in a drawer after the plan is written; it becomes the operating brief for your first year.
One practical example of the connection: if your target market analysis shows that your primary segment earns a median household income of $75,000–$95,000 and currently pays $120 per month for a comparable service, your pricing section can cite that directly. The market analysis creates the permission structure for every number that follows it.
What industry metrics should you measure, and where do you find them?
Industry analysis answers a narrower question than the full market analysis: “What is the condition of the sector my business is entering?” Four metrics belong in every industry section.
Industry size is the total annual revenue generated by businesses in your category, measured at the national level and, where possible, at the regional level. Growth trend covers the direction and rate of change over the past three to five years. Concentration describes whether the industry is dominated by a few large players or fragmented across many small ones. Regulation and barriers captures the licenses, safety standards, or capital requirements that affect entry.
Finding your NAICS code and pulling federal data
Your NAICS code (North American Industry Classification System) is the key that unlocks comparable federal data. Without the right code, you risk pulling numbers from a broader or narrower category than your actual business, which makes your size estimates either inflated or irrelevant. Look up your six-digit code on the Census NAICS search tool, then use it to query the Census Bureau’s Economic Census, the BLS Quarterly Census of Employment and Wages, and the BEA’s industry accounts.
For national and regional industry numbers, Data is the most direct starting point. Search by NAICS code and filter by geography to get state- or county-level business counts, payroll, and revenue. BLS datasets add employment and wage data that help you understand labor costs and workforce availability in your sector. BEA consumer spending reports give you the demand-side picture: how much households are spending in categories that relate to your offer.
For product-based businesses, the U.S. Consumer Product Safety Commission publishes safety and recall statistics worth reviewing during industry analysis. A pattern of recalls in your product category is a regulatory risk that belongs in your plan.
Pro Tip: When you find a national industry revenue figure, do not report it as your market. Instead, apply a geographic and demographic filter. If your business serves one metro area and your target customer is a specific income bracket, multiply the national figure by the share of the U.S. population in that geography and income band. That narrowed number is what investors expect to see.
How do you define and quantify your target market?
Defining your target market is not about describing everyone who could theoretically buy from you. It is about identifying the specific group most likely to buy first, buy repeatedly, and refer others. That precision is what makes your SOM estimate credible.
Choosing your primary and secondary segments
Start with one primary segment defined by at least three dimensions: geography (city, region, or radius), demographics (age, income, household type, or firmographics for B2B), and behavior (what problem they are actively trying to solve and how they currently solve it). Add one or two secondary segments only if your business model genuinely serves them through the same product and channel.
A useful segmentation layout to populate in your plan:
| Segment | Size estimate | Key traits | Buying triggers | Typical channels |
|---|---|---|---|---|
| Primary | Pull from Census | Age, income, location | Problem urgency, price sensitivity | Where they search and buy |
| Secondary A | Pull from Census | Firmographic or demographic | Seasonal or event-driven | Online, referral, or retail |
Pull segment size estimates from data.census.gov using the American Community Survey tables. Filter by geography and the demographic variables that match your segment definition. That count becomes the population base for your SAM calculation.
Building a buyer persona
A persona is not a marketing exercise. In a business plan, it is evidence that you understand your customer well enough to reach them. Fill in these fields for your primary persona: first name (fictional), age range, occupation, annual income, the specific problem they face, how they currently solve it, where they research purchases, and what would make them switch. Keep it to a half-page. Investors read it to check whether your go-to-market strategy is aimed at a real person or a vague demographic.
Converting census counts into a reachable segment
Here is a simplified worked example. Suppose you are opening a fitness studio targeting women aged 25–44 in a mid-size metro area. The Census ACS table for that geography shows 48,000 women in that age range. That gives you a reachable pool of about 9,600 people, which becomes your SOM input before you apply your realistic capture rate.
How do you analyze your competition effectively?
Competitive analysis fails when it becomes a list of names with no analytical conclusion. The goal is to show that a gap exists in the market and that your business is positioned to fill it.
Direct vs. indirect competitors
Direct competitors offer the same product or service to the same customer. Indirect competitors solve the same problem through a different mechanism. Both matter. A meal-kit delivery service competes directly with other meal-kit brands and indirectly with grocery stores, restaurant delivery apps, and meal-prep services. Listing only direct competitors makes your analysis look incomplete to any experienced reader.
For each competitor, measure: price point, primary distribution channel, customer review themes (what customers praise and what they complain about), and the one or two strengths that make them hard to displace.
Mapping your competitive position
A positioning matrix plots two dimensions that matter to your customer. Common axis pairs: price (low to high) vs. specialization (generalist to specialist), or convenience (low to high) vs. quality (low to high). Place each competitor on the grid, then mark where your business sits. The goal is to show that your position occupies a space that is either underserved or not served at all.

Pro Tip: Before you finalize your competitor list, search Google Maps and Yelp for your service category in your target geography. Sort by review count, not rating. The businesses with the most reviews are the ones your customers already know. Read the one-star and two-star reviews carefully. The recurring complaints in those reviews are the white-space your positioning should address directly.
Writing your positioning statement
Use this template: “For [primary customer segment] who [specific problem], [your business name] is the [category] that [key differentiator], unlike [alternative], because [proof point].”
That single sentence should appear in your market analysis and carry forward, word-for-word, into your marketing and sales sections. Consistency across sections signals to investors that your strategy is integrated, not assembled from separate documents.
How do you estimate TAM, SAM, and SOM with real math?
TAM, SAM, and SOM are the three concentric circles of market sizing. Investors focus almost entirely on SOM because it is the only number that reflects what your business can realistically capture in the near term.
SAM (Serviceable Addressable Market): The portion of TAM you can reach with your current product, geography, and distribution model.
SOM (Serviceable Obtainable Market): The realistic share of SAM you can capture in years one through three, given your resources and competitive position.
Top-down method
Start with a national or industry-wide figure from a federal source, then scale it down by applying geographic and demographic filters.
- Find total U.S. industry revenue from the Census Economic Census or a BEA industry account.
- Identify your geography’s share of the U.S. population or relevant demographic.
- Apply that share to the national figure to get a regional TAM.
- Filter further by your target segment’s share of the regional population to get SAM.
- Apply a realistic capture rate (typically 1%–5% for a new entrant) to get SOM.
BLS Consumer Price Index data help you adjust historical revenue figures to current-year dollars when your source data is more than two years old. Federal Reserve H.15 releases give you current interest-rate context, which matters when your SOM depends on consumer financing or when you are stress-testing demand sensitivity.
Bottom-up method
Work from unit economics upward. This approach is often more credible for early-stage businesses because it forces you to state concrete assumptions.
| Input | Value | Source |
|---|---|---|
| Average transaction value | $X per customer | Your pricing model |
| Realistic monthly customer count (Year 1) | Y customers | Capacity or channel constraint |
| Monthly revenue estimate | $X × Y | Calculated |
| Annual SOM | Monthly × — | Calculated |
| Growth assumption (Year 2) | Z% increase | Industry growth rate from BLS/BEA |
A worked example: a mobile dog-grooming service charges $85 per appointment. The owner can complete 6 appointments per day, 5 days per week, 48 weeks per year. That is a maximum annual capacity of 1,440 appointments, or $122,400 in revenue at full utilization. That number is defensible because every assumption is visible and checkable.
Document every source, every date, and every assumption in a footnote or appendix. Investors who want to verify your figures should be able to trace each number back to a specific federal table or primary research result.
What are the best U.S. data sources for market research?
The SBA recommends starting with federal secondary data before spending time or money on primary research. That sequence makes sense: secondary data tells you what the market looks like at scale; primary research tells you whether your specific offer resonates with real buyers.
Secondary sources: federal data first
- Data: Demographics, business counts, income distribution, and geographic breakdowns. Use the American Community Survey for population data and the Economic Census for industry revenue.
- Census: Identify your six-digit industry code before querying any other federal database.
- Bls: Employment levels, wage data, and industry-specific labor statistics. Also the source for CPI data when you need to adjust prices for inflation.
- Bea: Consumer spending by category and GDP by industry. Use this to show demand-side growth trends.
- Federal Reserve H.15: Current interest rates and yield data. Relevant when your business model involves consumer credit or when you are modeling demand sensitivity to borrowing costs. The Fed’s G.19 consumer credit release adds household debt metrics that help you estimate purchasing power constraints.
- Census Business Builder: A simplified tool for finding local business counts and basic market demographics, useful for bottom-up SOM estimates.
- Google Trends: Free, real-time search-interest data. Use it to show whether interest in your category is growing, seasonal, or declining. It does not give revenue figures, but it gives directional trend evidence that complements your federal data.
- Pew Research Center: Useful for behavioral and attitudinal data on specific demographic groups, particularly for consumer-facing businesses.
Primary research: low-cost methods that investors value
Primary research carries weight precisely because it is specific to your offer, not just your industry. Three methods that work on a founder’s budget:
Online survey (1–2 weeks, near zero cost): Use Google Forms or Typeform. Target 30–50 respondents who match your primary persona. Ask about the problem, current solutions, willingness to pay, and where they search for options. Document the response count and methodology in your plan.
Five customer interviews (1 week, zero cost): Recruit through LinkedIn, local community groups, or your existing network. Ask open-ended questions about the problem and current behavior. Five interviews will surface patterns that a survey cannot capture.
Small pilot or pre-sale (2–4 weeks, variable cost): Offer your product or service to a small group before launch. Even 10 paying customers is primary evidence of demand that no secondary source can replicate. This is the validation step that connects market analysis findings to real demand.
For a deeper look at how to structure these validation steps, Nomadexcel’s guide to business validation for early-stage founders walks through the sequencing in detail.
Statista and IBISWorld are paywalled industry research platforms. Both aggregate data from multiple sources and present it in ready-to-cite formats. Statista offers some free reports; IBISWorld requires a subscription or library access. Use them to supplement federal data when you need a pre-packaged industry overview, but always cross-check their figures against the underlying federal sources they cite.
How should you structure and present the market analysis section?
Structure matters as much as substance. A market analysis that buries its conclusions in dense paragraphs will not get read carefully, regardless of how good the underlying research is.
Recommended headings and subheadings
Use these in order within your market analysis section:
- Industry Overview (size, growth, trends, regulation)
- Target Market (primary segment, persona, demographics)
- Market Size (TAM, SAM, SOM with methodology)
- Competitive Analysis (direct, indirect, positioning matrix)
- Positioning (your positioning statement and differentiation rationale)
Visuals that strengthen credibility
Three visuals do the most work in a market analysis:
A TAM/SAM/SOM funnel or nested bar chart makes the sizing logic visual. Readers grasp the narrowing logic faster from a graphic than from three separate paragraphs.
A one-page competitive positioning matrix shows your market position at a glance. Label the axes with dimensions that matter to your customer, not dimensions that make you look good.
A persona snapshot card (name, photo placeholder, key stats, and buying trigger) humanizes the target market section and makes it memorable in a pitch meeting.
Every visual needs a source footnote. If the data behind a chart came from a Census table, name the table and the date. That footnote is what separates a credible analysis from a polished-looking guess.
Linking market analysis to financials
The connection should be explicit, not implied. It tells the reader that the financial section did not generate its own numbers independently; it drew them from the market analysis.
Sample lead paragraph for the market analysis section
The U.S. mobile pet grooming market falls under NAICS code 812910 (Pet Care Services, except Veterinary). According to the Census Bureau’s most recent Economic Census, the pet care services industry generates approximately $10 billion in annual revenue nationally, with consistent growth driven by rising pet ownership rates. This analysis focuses on the [City] metropolitan area, where data.census.gov reports 142,000 households with at least one dog, representing a serviceable addressable market of approximately $24 million at current average spending levels. Our serviceable obtainable market for year one is $73,440, based on operational capacity and a conservative 60% utilization assumption.
That paragraph cites sources, states geography, and connects directly to the financial section. It is the model to follow.
A step-by-step checklist and template for your market analysis
Use this as your one-week research sprint. Complete the items in order; each one feeds the next.
- Look up your NAICS code at census.gov/naics and record the six-digit code.
- Pull industry size and growth data from data.census.gov using your NAICS code. Note the source table name and date.
- Check BLS employment and wage data for your industry category to understand labor costs and workforce size.
- Review BEA consumer spending data for the category most relevant to your offer.
- Define your primary customer segment using three variables: geography, demographics, and behavior.
- Pull segment population counts from data.census.gov (American Community Survey). Record the table number.
- Calculate TAM, SAM, and SOM using both top-down and bottom-up methods. Document every assumption.
- Identify your top 3 competitors (at least one direct, one indirect). Record their price, channel, and one key weakness from customer reviews.
- Run 5 customer interviews or a 30-person survey to validate the problem and willingness to pay.
- Write your positioning statement using the template from the competitive analysis section.
For a complementary set of validation steps that pairs with this sprint, Nomadexcel’s startup idea validation checklist covers the common pitfalls founders hit in weeks one and two.
Copy-ready template
[Business Name] Market Analysis
Industry Overview
The [industry name] industry (NAICS [code]) generates approximately $[X] in annual U.S. Key trends include [trend 1] and [trend 2]. Relevant regulations include [regulation or barrier].
Target Market
Our primary customer segment is [description: age, income, geography, behavior]. Census Bureau’s American Community Survey ([table, year]), there are approximately [X] households/individuals matching this profile in our target geography. This segment currently spends an estimated $[X] annually on [category], based on [source].
Market Size
Our total addressable market is approximately $[TAM], based on [source and method]. Our serviceable addressable market, filtered to [geography and segment], is $[SAM]. Our serviceable obtainable market for year one is $[SOM], calculated using a [bottom-up/top-down] method assuming [key assumption]. Full methodology is documented in Appendix [X].
Competitive Positioning
Our three primary competitors are [Competitor A], [Competitor B], and [Competitor C]. [Competitor A] leads on [dimension]; [Competitor B] serves a different segment at a lower price point. Our positioning: “[Positioning statement].”
How the checklist feeds the template
A founder working through the checklist above will complete step 7 (TAM/SAM/SOM calculation) before writing the Market Size paragraph in the template. The Census table number recorded in step 6 becomes the inline citation in that paragraph. The positioning statement written in step 10 drops directly into the final line of the template. The checklist is not a separate exercise; it is the research process that fills the template’s placeholders with real numbers.
What mistakes do founders most often make in market analysis?
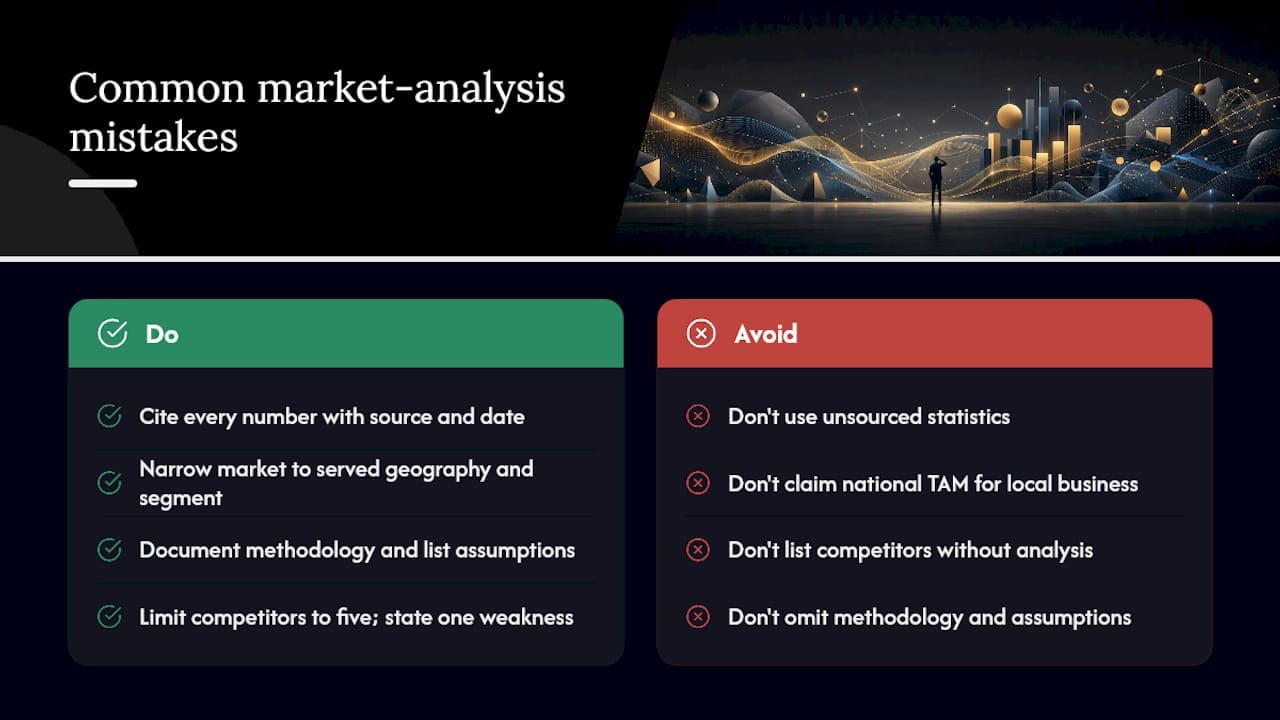
The most damaging errors are not factual errors. They are structural ones: presenting numbers without sources, sizing the market at the national level when the business is local, and listing competitors without drawing any conclusion from the list.
Unsourced statistics are the fastest way to lose credibility with an experienced reader. If a number does not have a named source and a date, it reads as invented. Fix: every figure gets a footnote with the source name, the specific table or report, and the date it was accessed.
Oversized TAM is the second most common mistake. Claiming the entire U.S. healthcare market as your TAM when you run a single-location wellness clinic signals that you have not done the narrowing work. Fix: apply geographic and demographic filters before you report any market size figure.
The laundry list of competitors lists names without analysis. Investors do not need to know that 15 competitors exist; they need to know why customers will choose you over the three most relevant ones. Fix: limit your competitive analysis to five competitors maximum, and for each one, state one specific weakness your business addresses.
No documented methodology means your TAM/SAM/SOM numbers cannot be verified. Fix: include a one-paragraph methodology note (or an appendix entry) that states the source, the date, the calculation steps, and the assumptions used.
Best practices in brief: Cite every number. Narrow your market to the geography and segment you actually serve. Map competitors on a dimension that matters to your customer, not just on price. Connect every market analysis conclusion to a specific decision in your marketing, pricing, or financial section. Document your assumptions so any reader can retrace your math.
Pro Tip: Write your assumptions list before you write your market analysis. Every number you include rests on at least one assumption (geographic share, participation rate, capture rate). Listing those assumptions explicitly, either in the body or an appendix, protects you in due diligence and shows investors that you understand the limits of your own projections.
For product-based businesses, reviewing CPSC safety and recall data during the industry analysis phase is a step many founders skip. A recall pattern in your product category is a regulatory risk that belongs in your plan, not a surprise that surfaces after launch.
Understanding how data shapes marketing decisions at every stage is also worth internalizing before you finalize your analysis. The discipline of sourcing and documenting market data carries directly into how you build and measure your marketing strategy post-launch.
The Nomadexcel perspective on teaching market analysis
Most founders approach market analysis as a writing task. They sit down to fill a section of a document. The result is usually a collection of industry statistics that do not connect to each other or to the financial projections that follow.
At Nomadexcel, we teach it as a research sprint with a defined output at the end of each day. Day one: NAICS code and industry snapshot. Day two: target segment defined and sized. Day three: TAM/SAM/SOM calculated with both methods. Day four: top three competitors mapped on a positioning matrix. Day five: positioning statement written and tested against the customer interviews from the same week.
What changes when you work that way is not the quality of the data. Federal sources are the same for everyone. What changes is the connection between each piece of research and the business decision it informs. Founders who work through the sprint leave with a market analysis that reads as a coherent argument, not a collection of facts.
The other thing worth saying plainly: primary research is not optional for a credible plan. Five customer interviews conducted in a single week will tell you more about your SOM than any industry report, because they tell you whether real people in your target segment will pay your price for your specific offer. Secondary data tells you the market exists. Primary research tells you whether your version of the solution fits it.
If you want to compress this process further and work through it with mentors and a peer group, Nomadexcel’s entrepreneurship bootcamp program is built around exactly this kind of structured sprint.
Nomadexcel’s bootcamp gives you a market analysis you can actually use
Knowing the steps and executing them under pressure are two different things. Nomadexcel’s Online Entrepreneurship Bootcamp is built for founders who want to produce an investor-ready market analysis in days, not months, with expert feedback at every stage.
Participants leave with:
- A validated TAM/SAM/SOM with documented sources and methodology
- A competitive positioning map with a written positioning statement
- A pitch-ready market analysis section formatted for a business plan or investor deck
- Direct mentorship from experienced operators who have built and funded businesses
The bootcamp format compresses what most founders spend weeks on into focused sprints, with accountability built in. If you are ready to move from research to a finished, credible market analysis, explore the bootcamp and see the next available cohort.
Useful sources and recommended tools
Recommended tools
Google Trends is free and shows search-interest trends over time by geography. Use it to demonstrate whether interest in your category is growing or seasonal, and to compare relative interest across related search terms.
Pew Research Center publishes behavioral and attitudinal surveys on specific demographic groups. Useful for consumer-facing businesses that need to show how their target segment thinks and behaves, beyond what Census demographics capture.
Google Forms / Typeform are the practical tools for running a 30-to-50-person primary research survey at no cost. Both export to spreadsheets for easy analysis and documentation.
Paywalled industry services
Statista aggregates data from hundreds of sources and presents it in citable, formatted reports. Some reports are free; others require a subscription. It is a useful shortcut for industry overviews, but always verify Statista’s figures against the underlying federal sources it cites before including them in your plan.
IBISWorld provides detailed industry reports by NAICS code, including five-year forecasts and competitive landscape summaries. Access typically requires a paid subscription or a library database login. Worth using when you need a pre-packaged industry narrative to supplement your federal data, particularly for industries where the Economic Census data is several years old.
For a broader look at how marketing data skills connect to the decisions your market analysis informs, the in-demand marketing skills guide from SemLocal covers the practical competencies that translate research into strategy.
Sources
Census Bureau / data.census.gov is your primary source for demographic data, business counts, and geographic breakdowns. Use the American Community Survey for population and income data; use the Economic Census for industry revenue by NAICS code. The Census Business Builder simplifies local market lookups for founders who are not familiar with the full Census interface.
NAICS lookup at census.gov is the starting point for every industry analysis. Find your six-digit code first, then use it consistently across every federal database you query.
Bureau of Labor Statistics (BLS) at bls.gov/data covers employment levels, wages, and industry-specific labor statistics. The CPI pages are the federal standard for tracking price and inflation trends, which you need when adjusting historical revenue figures or modeling pricing strategy.
Bureau of Economic Analysis (BEA) at bea.gov publishes consumer spending by category and GDP by industry. Use these reports to show demand-side growth trends and to support your TAM calculation with spending-based evidence.
Federal Reserve publishes the H.15 rate release for current interest-rate data and the G.19 consumer credit series for household debt metrics. Both are relevant when your business model depends on consumer purchasing power or when you are stress-testing demand assumptions.
Comments are closed.